Automatically select the appropriate plotting function based on the number of rows in the catalog.
Arguments
- catalog
Numeric vector, single-column data.frame, matrix, tibble, or data.table. The number of rows (or length) determines which plotting function is used:
1536 rows: calls
plot_SBS1536()476 rows: calls
plot_ID476()288 rows: calls
plot_SBS288()192 rows: calls
plot_SBS192()166 rows: calls
plot_ID166()144 rows: calls
plot_DBS144()136 rows: calls
plot_DBS136()96 rows: calls
plot_SBS96()89 rows: calls
plot_ID89()83 rows: calls
plot_ID83()78 rows: calls
plot_DBS78()
The column names of
catalogare used as plot titles.- ...
Additional arguments passed to the underlying plotting function.
- filename
Character. Path to the output PDF file (
plot_guess_pdfonly).
Value
plot_guess() returns a plot object. The exact class depends on
the dispatched function: most return a ggplot object; SBS288, DBS136,
and SBS1536 return patchwork objects. Note: adding ggplot2 layers with
+ to a patchwork object (e.g. + ggtitle()) applies only to the last
sub-plot, not the composite; use patchwork::plot_annotation() instead.
plot_guess_pdf() returns NULL invisibly (called for side effect of
creating a PDF file).
Details
plot_guess() plots a single sample. plot_guess_pdf() creates a
multi-page PDF file containing plots for multiple samples, arranged with
5 samples per page (except heatmap types: 1 per page). Uses Cairo for
high-quality PDF rendering.
Examples
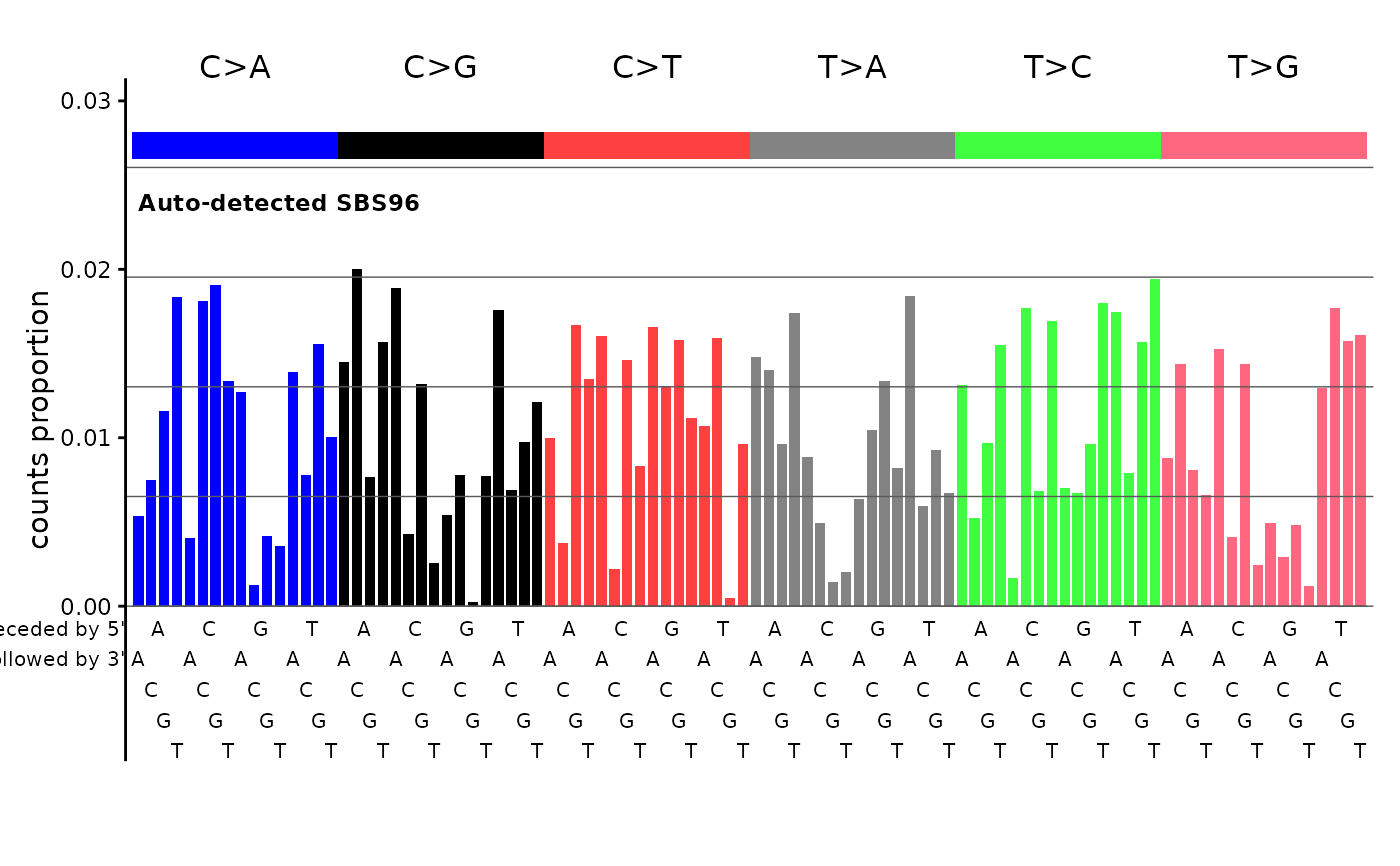
# Auto-detect a 96-channel catalog and dispatch to plot_SBS96
set.seed(1)
sig <- runif(96)
sig <- sig / sum(sig)
names(sig) <- catalog_row_order()$SBS96
plot_guess(sig, plot_title = "Auto-detected SBS96")


# \donttest{
sig <- matrix(runif(96 * 3), nrow = 96)
rownames(sig) <- catalog_row_order()$SBS96
colnames(sig) <- paste0("Sig", 1:3)
plot_guess_pdf(sig, filename = tempfile(fileext = ".pdf"))
# }
# \donttest{
sig <- matrix(runif(96 * 3), nrow = 96)
rownames(sig) <- catalog_row_order()$SBS96
colnames(sig) <- paste0("Sig", 1:3)
plot_guess_pdf(sig, filename = tempfile(fileext = ".pdf"))
# }