plot_DBS144, plot_DBS144_pdf, plot_DBS78, plot_DBS78_pdf, plot_ID166, plot_ID166_pdf, plot_ID476, plot_ID476_pdf, plot_ID476_right, plot_ID476_right_pdf, plot_ID83, plot_ID83_pdf, plot_ID89, plot_ID89_pdf, plot_SBS12, plot_SBS12_pdf, plot_SBS192, plot_SBS192_pdf, plot_SBS288, plot_SBS96, plot_SBS96_pdf
Source:R/plot_DBS144.R, R/plot_DBS144_pdf.R, R/plot_DBS78.R, and 19 more
bar_plots.RdPlot functions for SBS, DBS, and indel mutational signature catalogs
as bar charts. Most functions return ggplot2 objects; plot_SBS288
returns a patchwork object.
Usage
plot_DBS144(
  catalog,
  plot_title = NULL,
  show_axis_text_x = TRUE,
  show_axis_text_y = TRUE,
  show_axis_title_x = TRUE,
  show_axis_title_y = TRUE,
  ylim = NULL,
  base_size = 11,
  plot_title_cex = 1,
  title_outside_plot = FALSE,
  axis_text_x_cex = 0.5,
  axis_title_x_cex = 0.8,
  axis_title_y_cex = 0.8,
  axis_text_y_cex = 0.7,
  grid = FALSE
)

plot_DBS144_pdf(catalog, filename, ...)

plot_DBS78(
  catalog,
  plot_title = NULL,
  grid = FALSE,
  upper = TRUE,
  show_axis_text_x = TRUE,
  show_axis_text_y = TRUE,
  show_axis_title_x = FALSE,
  show_axis_title_y = TRUE,
  ylim = NULL,
  base_size = 11,
  plot_title_cex = 1,
  title_outside_plot = FALSE,
  count_label_cex = 0.9,
  class_label_cex = 0.8,
  axis_text_x_cex = 0.5,
  axis_title_x_cex = 0.8,
  axis_title_y_cex = 0.8,
  axis_text_y_cex = 0.7,
  show_counts = NULL,
  num_peak_labels = 0,
  peak_label_cex = 0.7
)

plot_DBS78_pdf(catalog, filename, ...)

plot_ID166(
  catalog,
  plot_title = NULL,
  grid = FALSE,
  upper = TRUE,
  show_axis_text_x = TRUE,
  show_axis_text_y = TRUE,
  show_axis_title_x = FALSE,
  show_axis_title_y = TRUE,
  ylim = NULL,
  base_size = 11,
  plot_title_cex = 1,
  title_outside_plot = FALSE,
  title_x = 0.4,
  count_label_cex = 0.9,
  block_label_cex = 0.65,
  class_label_cex = 0.8,
  axis_text_x_cex = 0.5,
  bottom_label_cex = 0.65,
  axis_title_x_cex = 0.8,
  axis_title_y_cex = 0.8,
  axis_text_y_cex = 0.7,
  show_counts = NULL,
  num_peak_labels = 0,
  peak_label_cex = 0.7
)

plot_ID166_pdf(catalog, filename, ...)

plot_ID476(
  catalog,
  plot_title = NULL,
  base_size = 11,
  plot_title_cex = 1,
  title_outside_plot = FALSE,
  title_x = 0.4,
  count_label_cex = 0.9,
  class_label_cex = 0.8,
  axis_text_x_cex = 0.5,
  axis_title_x_cex = 0.8,
  axis_title_y_cex = 0.8,
  axis_text_y_cex = 0.7,
  show_axis_text_x = TRUE,
  show_axis_text_y = TRUE,
  show_axis_title_x = TRUE,
  show_axis_title_y = TRUE,
  show_counts = NULL,
  num_peak_labels = 4,
  peak_label_cex = 0.7,
  label_threshold_denominator = 7,
  vline_labels = c(),
  simplify_labels = FALSE,
  plot_complex = FALSE,
  grid = FALSE
)

plot_ID476_pdf(catalog, filename, ...)

plot_ID476_right(
  catalog,
  plot_title = NULL,
  base_size = 11,
  plot_title_cex = 1,
  title_outside_plot = FALSE,
  title_x = 0.4,
  count_label_cex = 0.9,
  class_label_cex = 0.8,
  axis_text_x_cex = 0.5,
  axis_title_x_cex = 0.8,
  axis_title_y_cex = 0.8,
  axis_text_y_cex = 0.7,
  show_axis_text_x = TRUE,
  show_axis_text_y = TRUE,
  show_axis_title_x = TRUE,
  show_axis_title_y = TRUE,
  show_counts = NULL,
  num_peak_labels = 3,
  peak_label_cex = 0.7,
  label_threshold_denominator = 7,
  vline_labels = c(),
  simplify_labels = TRUE,
  plot_complex = FALSE,
  grid = FALSE
)

plot_ID476_right_pdf(catalog, filename, ...)

plot_ID83(
  catalog,
  plot_title = NULL,
  grid = FALSE,
  upper = TRUE,
  show_axis_text_x = TRUE,
  show_axis_text_y = TRUE,
  show_axis_title_x = TRUE,
  show_axis_title_y = TRUE,
  ylim = NULL,
  base_size = 11,
  plot_title_cex = 1,
  title_outside_plot = FALSE,
  title_x = 0.4,
  count_label_cex = 0.9,
  block_label_cex = 0.65,
  class_label_cex = 0.8,
  axis_text_x_cex = 0.5,
  bottom_label_cex = 0.65,
  axis_title_x_cex = 0.8,
  axis_title_y_cex = 0.8,
  axis_text_y_cex = 0.7,
  show_counts = NULL,
  num_peak_labels = 0,
  peak_label_cex = 0.7
)

plot_ID83_pdf(catalog, filename, ...)

plot_ID89(
  catalog,
  plot_title = NULL,
  upper = TRUE,
  show_axis_text_x = TRUE,
  show_axis_text_y = TRUE,
  show_axis_title_x = TRUE,
  show_axis_title_y = TRUE,
  ylim = NULL,
  base_size = 11,
  plot_title_cex = 1,
  title_outside_plot = FALSE,
  title_x = 0.4,
  count_label_cex = 0.9,
  block_label_cex = 0.65,
  class_label_cex = 0.8,
  axis_text_x_cex = 0.5,
  axis_title_x_cex = 0.8,
  axis_title_y_cex = 0.8,
  axis_text_y_cex = 0.7,
  show_counts = NULL,
  plot_complex = FALSE,
  num_peak_labels = 0,
  peak_label_cex = 0.7,
  grid = FALSE
)

plot_ID89_pdf(catalog, filename, ...)

plot_SBS12(
  catalog,
  plot_title = NULL,
  abundance = NULL,
  show_axis_text_x = TRUE,
  show_axis_text_y = TRUE,
  show_axis_title_x = FALSE,
  show_axis_title_y = TRUE,
  ylim = NULL,
  base_size = 11,
  plot_title_cex = 1,
  title_outside_plot = FALSE,
  axis_text_x_cex = 0.5,
  axis_title_x_cex = 0.8,
  axis_title_y_cex = 0.8,
  axis_text_y_cex = 0.7,
  grid = FALSE
)

plot_SBS12_pdf(catalog, filename, ...)

plot_SBS192(
  catalog,
  plot_title = NULL,
  grid = FALSE,
  upper = TRUE,
  show_axis_text_x = TRUE,
  show_axis_text_y = TRUE,
  show_axis_title_x = FALSE,
  show_axis_title_y = TRUE,
  ylim = NULL,
  base_size = 11,
  plot_title_cex = 1,
  title_outside_plot = FALSE,
  title_x = 0,
  count_label_cex = 0.9,
  class_label_cex = 0.8,
  axis_text_x_cex = 0.5,
  axis_title_x_cex = 0.8,
  axis_title_y_cex = 0.8,
  axis_text_y_cex = 0.7,
  show_counts = NULL,
  num_peak_labels = 0,
  peak_label_cex = 0.7
)

plot_SBS192_pdf(catalog, filename, ...)

plot_SBS288(
  catalog,
  plot_title = NULL,
  plot_title_cex = 1,
  title_outside_plot = FALSE,
  ...
)

plot_SBS288_pdf(catalog, filename, ...)

plot_SBS96(
  catalog,
  plot_title = NULL,
  grid = FALSE,
  upper = TRUE,
  show_axis_text_x = TRUE,
  show_axis_text_y = TRUE,
  show_axis_title_x = FALSE,
  show_axis_title_y = TRUE,
  ylim = NULL,
  base_size = 11,
  plot_title_cex = 1,
  title_outside_plot = FALSE,
  title_x = 0,
  count_label_cex = 0.9,
  class_label_cex = 0.8,
  axis_text_x_cex = 0.5,
  axis_title_x_cex = 0.8,
  axis_title_y_cex = 0.8,
  axis_text_y_cex = 0.7,
  show_counts = NULL,
  num_peak_labels = 0,
  peak_label_cex = 0.7
)

plot_SBS96_pdf(catalog, filename, ...)
Arguments
- catalog
Numeric vector, single-column data.frame, matrix, tibble, or data.table. If there are row names (or for a vector, names), they will be checked against
catalog_row_order(). SBS functions also accept "stapled" row names (e.g.A[C>A]Afor SBS96,T:A[C>A]Afor SBS288), which are automatically converted to compact format before validation.- plot_title
Character. Title displayed above the plot.
- show_axis_text_x
Logical. If FALSE, hide x-axis tick labels.
- show_axis_text_y
Logical. If FALSE, hide y-axis tick labels.
- show_axis_title_x
Logical. If FALSE, hide the x-axis title.
- show_axis_title_y
Logical. If FALSE, hide the y-axis title.
- ylim
Optional y-axis limits. Either
NULL(auto) or a length-2 numeric vectorc(ymin, ymax), following ggplot2'sscale_y_continuous(limits = ...)convention. A scalar is rejected with an error.- base_size
Numeric. Base font size in points.
- plot_title_cex
Numeric. Multiplier for the plot title size.
- title_outside_plot
Logical. If FALSE, the title is drawn inside the plot panel as an annotation (the
plot_ID83style). If TRUE, the title is drawn above the panel viaggtitle(). Forplot_SBS288, TRUE places the overall title above the 3-panel composite viapatchwork::plot_annotation(); FALSE prepends the title to each strand label ("Template", "Non-template", "Not-transcribed").- axis_text_x_cex
Numeric. Multiplier for x-axis labels.
- axis_title_x_cex
Numeric. Multiplier for x-axis title size.
- axis_title_y_cex
Numeric. Multiplier for the y-axis title size.
- axis_text_y_cex
Numeric. Multiplier for the y-axis tick label size.
- grid
Logical, draw horizontal grid lines at
seq(0, ymax, ymax/4)over the data region. Available in all bar-plot functions exceptplot_SBS288(which forwardsgridto its threeplot_SBS96panels via...).- filename
Character. Path to the output PDF file (
_pdffunctions only).- ...
Additional arguments passed to
plot_SBS96()(plot_SBS288only).- upper
Logical, draw colored class rectangles and labels above bars (not available in
plot_DBS144,plot_SBS12,plot_SBS288).- count_label_cex
Numeric. Multiplier for per-class count labels (not available in
plot_DBS144,plot_SBS12).- class_label_cex
Numeric. Multiplier for major class labels.
- show_counts
Logical or NULL. If
TRUE, always display per-class count labels. IfFALSE, never display them. IfNULL, display them only when the catalog contains counts (sum > 1.1). Not available inplot_DBS144,plot_SBS12,plot_SBS288.- num_peak_labels
Integer. Number of top peaks to label (0 = none). Not available in
plot_DBS144,plot_SBS12,plot_SBS288.- peak_label_cex
Numeric. Size multiplier for peak labels.
- title_x
Numeric fraction in [0, 1] giving the horizontal position of the inside-panel title, as a fraction of the plot's bar range (0 = left edge, 1 = right edge). Ignored when
title_outside_plot = TRUE. Default is 0 (far left) for SBS plots and 0.4 (a bit left of center) for ID plots, where the far-left corner often collides with ggrepel peak labels. Only available inplot_SBS96,plot_SBS192,plot_ID83,plot_ID89,plot_ID166,plot_ID476,plot_ID476_right.- block_label_cex
Numeric. Multiplier for colored category block labels (indel plots only).
- bottom_label_cex
Numeric. Multiplier for bottom category description labels (indel plots only).
- label_threshold_denominator
Numeric. Peaks below max/label_threshold_denominator are not labeled (
plot_ID476,plot_ID476_rightonly).- vline_labels
Character vector. IndelType labels at which to draw vertical reference lines (
plot_ID476,plot_ID476_rightonly).- simplify_labels
Logical. Simplify peak labels by removing the indel type prefix (
plot_ID476,plot_ID476_rightonly).- plot_complex
Logical. Include Complex indel channels (
plot_ID89,plot_ID476,plot_ID476_rightonly).- abundance
Numeric vector of per-class abundances for strand bias testing (
plot_SBS12only).
Value
Plot functions return a ggplot2 object (or a patchwork object for
plot_SBS288), or NULL with a warning if the catalog is invalid (wrong
size or row names). PDF functions return NULL invisibly (called for side
effect of creating a PDF file), or stop with an error if the catalog is
invalid.
Details
Functions in this family:
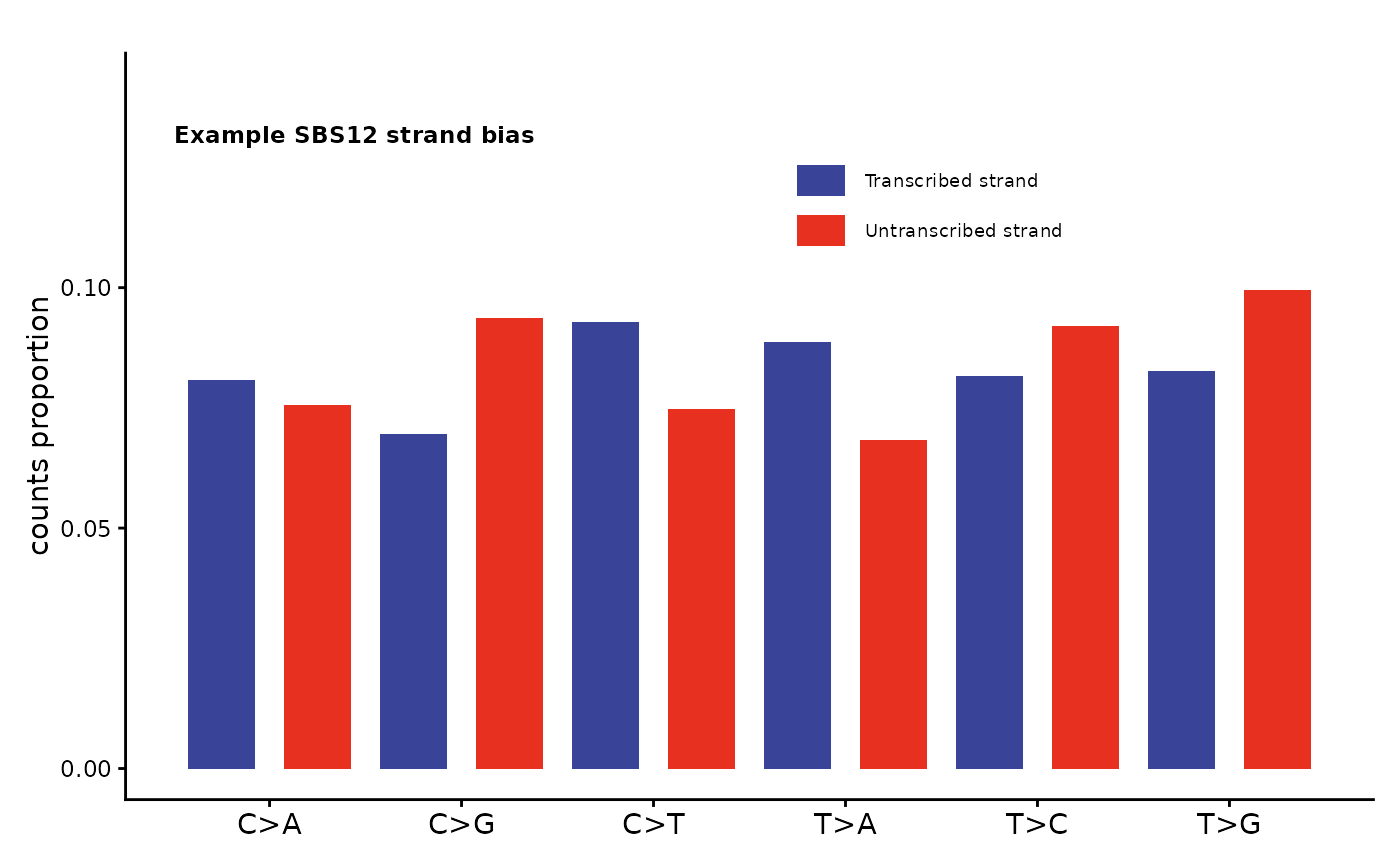
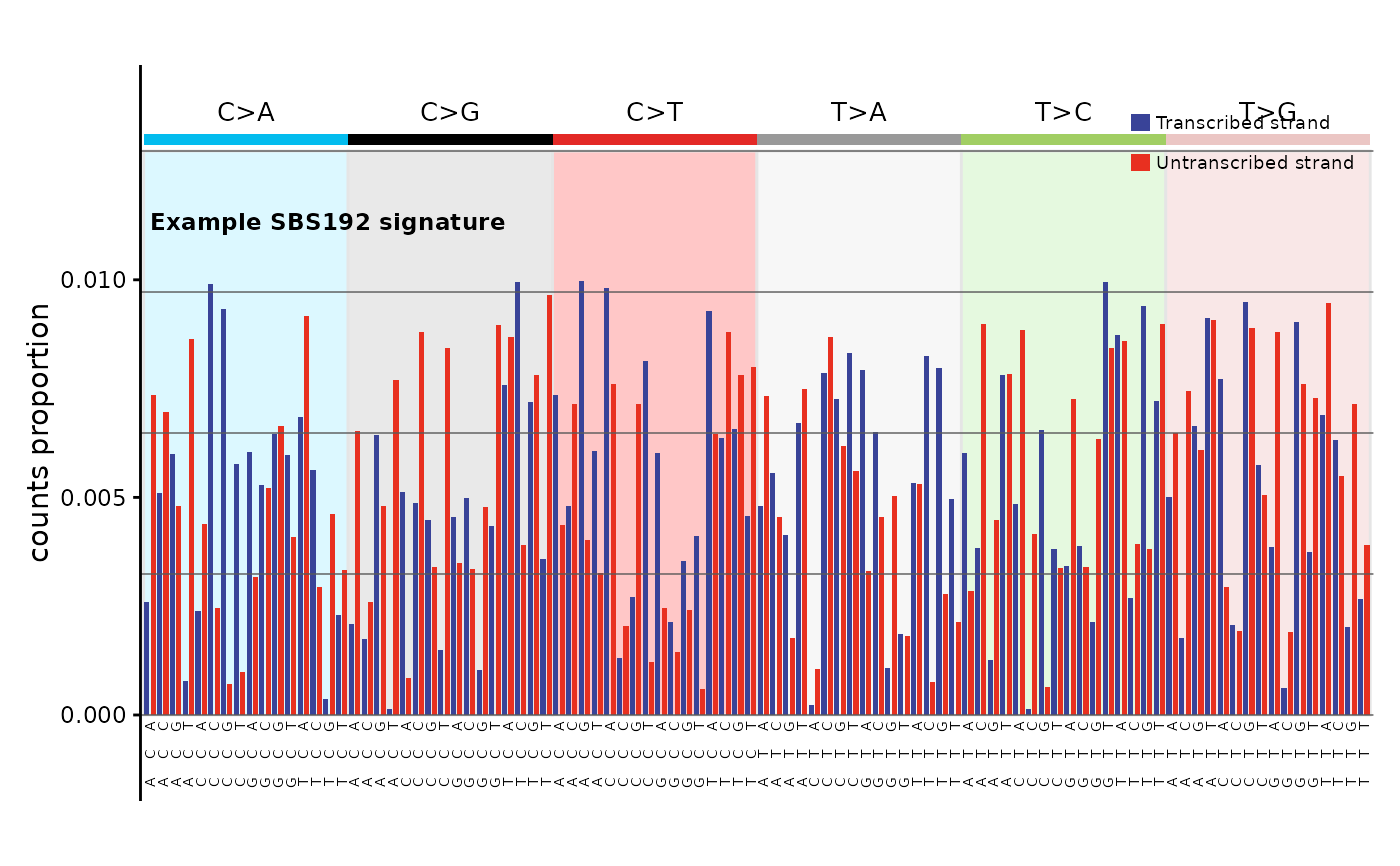
plot_SBS96,plot_SBS192: SBS trinucleotide contextplot_DBS78: DBS dinucleotide substitutionsplot_DBS144: DBS with transcription strandplot_SBS12: SBS strand bias summary (collapses 192 to 12 bars)plot_SBS288: SBS with three-strand contextplot_ID166: Indel genic/intergenic (166 channels)plot_ID83: Indel COSMIC classification (83 channels)plot_ID89: Indel Koh classification (89 channels)plot_ID476,plot_ID476_right: Indel with flanking context (476 channels)
Each has a corresponding _pdf() variant for multi-sample PDF export.
Examples
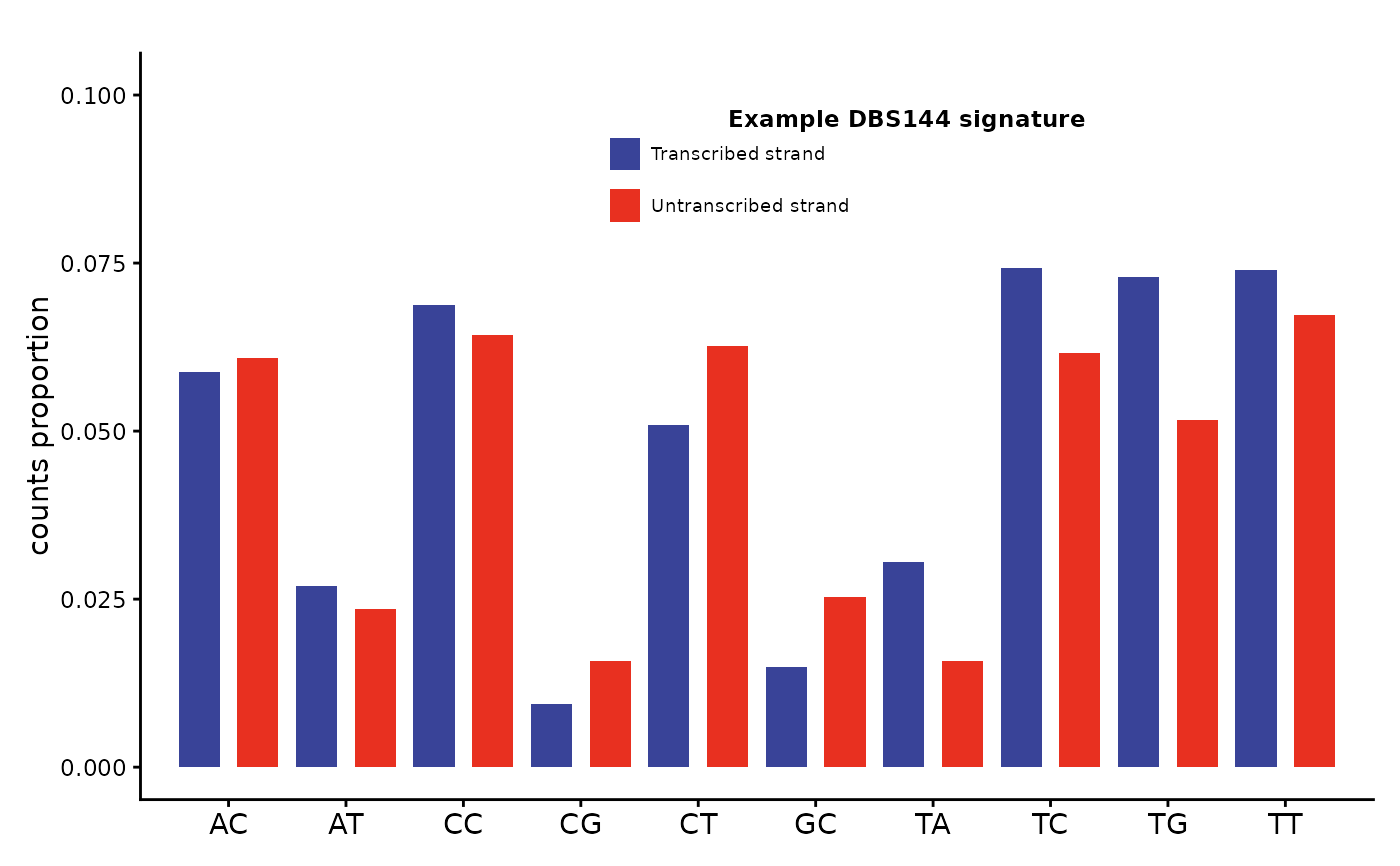
set.seed(1)
sig <- runif(144)
sig <- sig / sum(sig)
names(sig) <- catalog_row_order()$DBS144
plot_DBS144(sig, plot_title = "Example DBS144 signature")
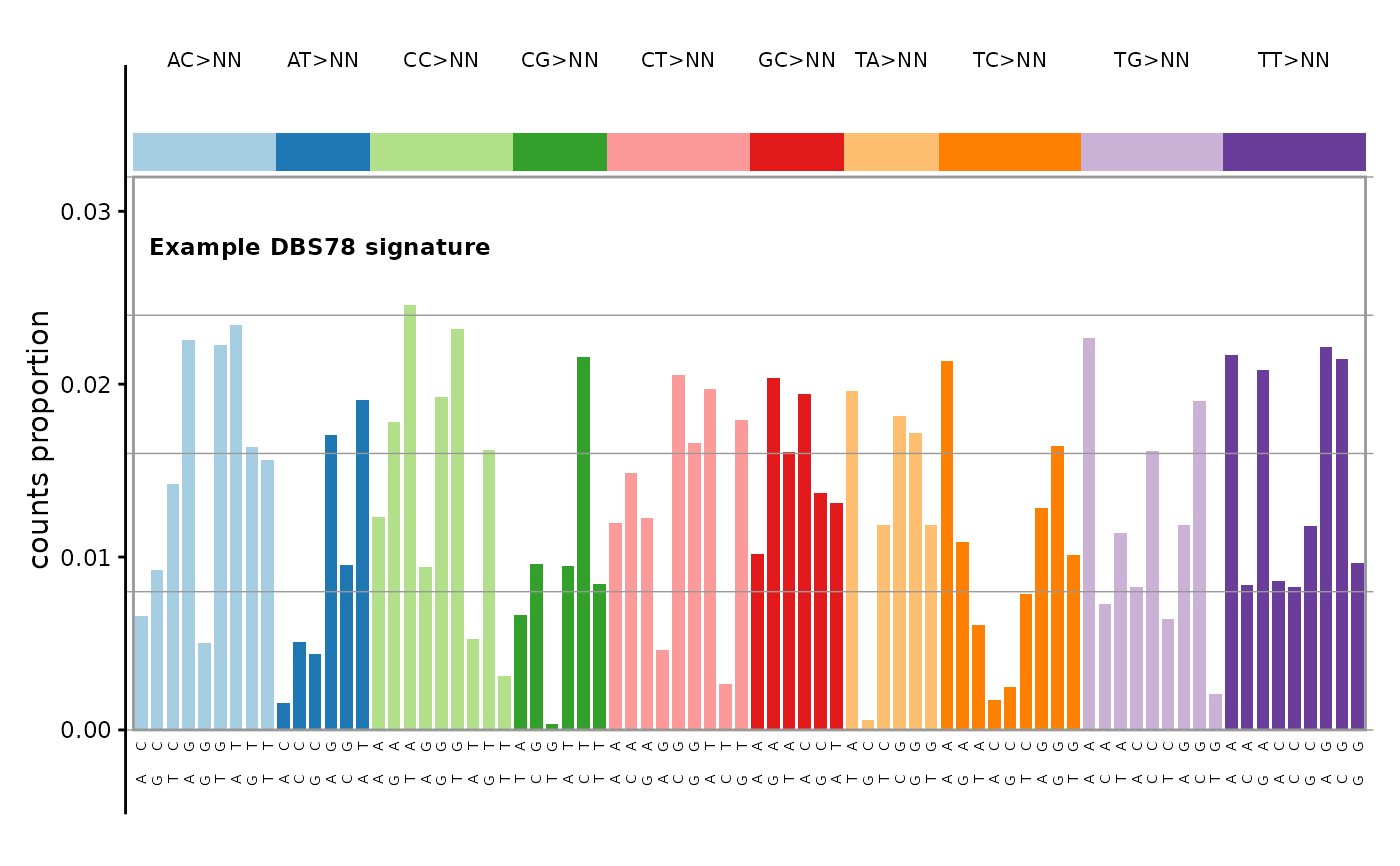
 set.seed(1)
sig <- runif(78)
sig <- sig / sum(sig)
names(sig) <- catalog_row_order()$DBS78
plot_DBS78(sig, plot_title = "Example DBS78 signature")
set.seed(1)
sig <- runif(78)
sig <- sig / sum(sig)
names(sig) <- catalog_row_order()$DBS78
plot_DBS78(sig, plot_title = "Example DBS78 signature")
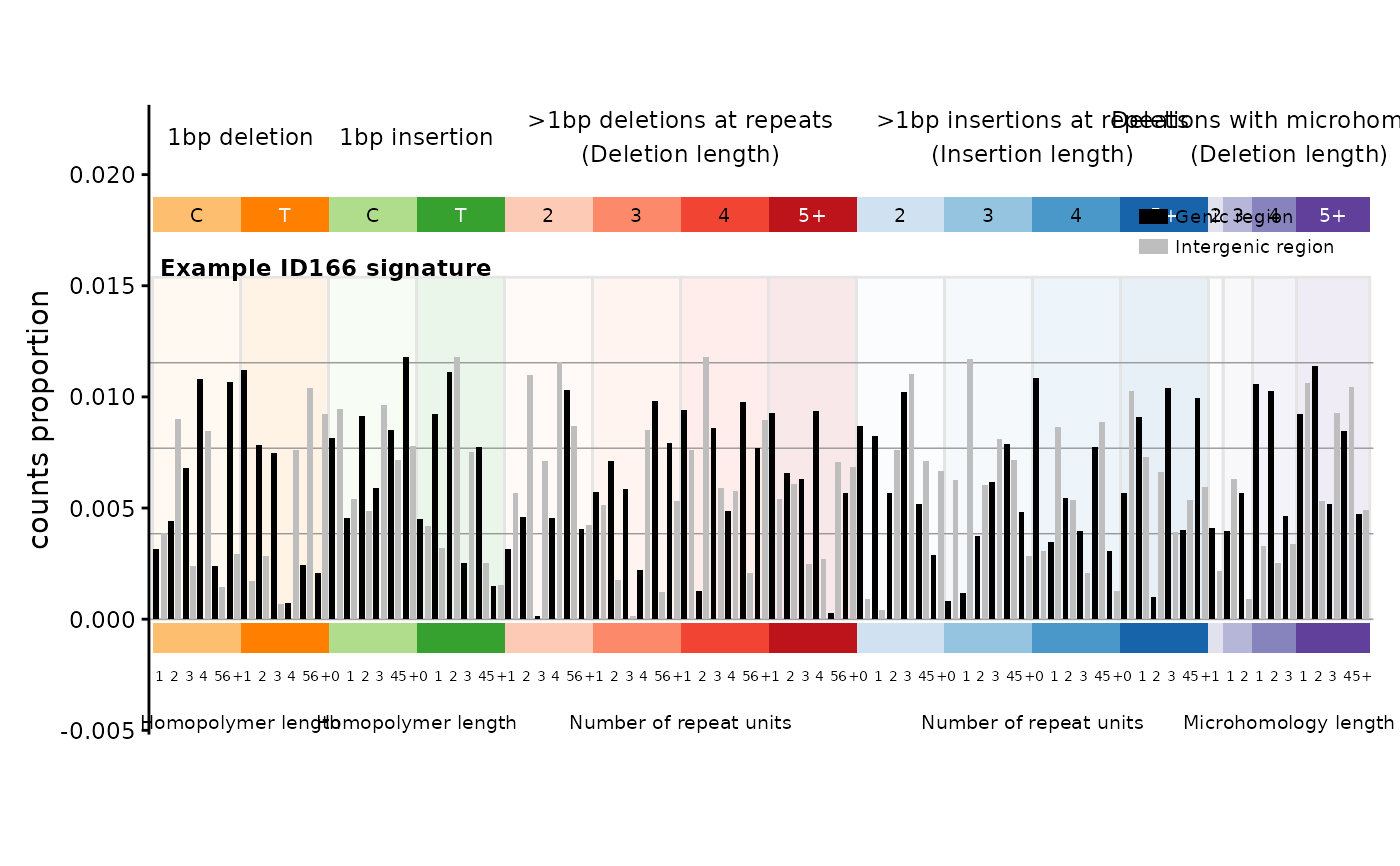
 set.seed(1)
sig <- runif(166)
sig <- sig / sum(sig)
names(sig) <- catalog_row_order()$ID166
plot_ID166(sig, plot_title = "Example ID166 signature")
set.seed(1)
sig <- runif(166)
sig <- sig / sum(sig)
names(sig) <- catalog_row_order()$ID166
plot_ID166(sig, plot_title = "Example ID166 signature")
 # \donttest{
set.seed(1)
sig <- runif(476)
sig <- sig / sum(sig)
names(sig) <- catalog_row_order()$ID476
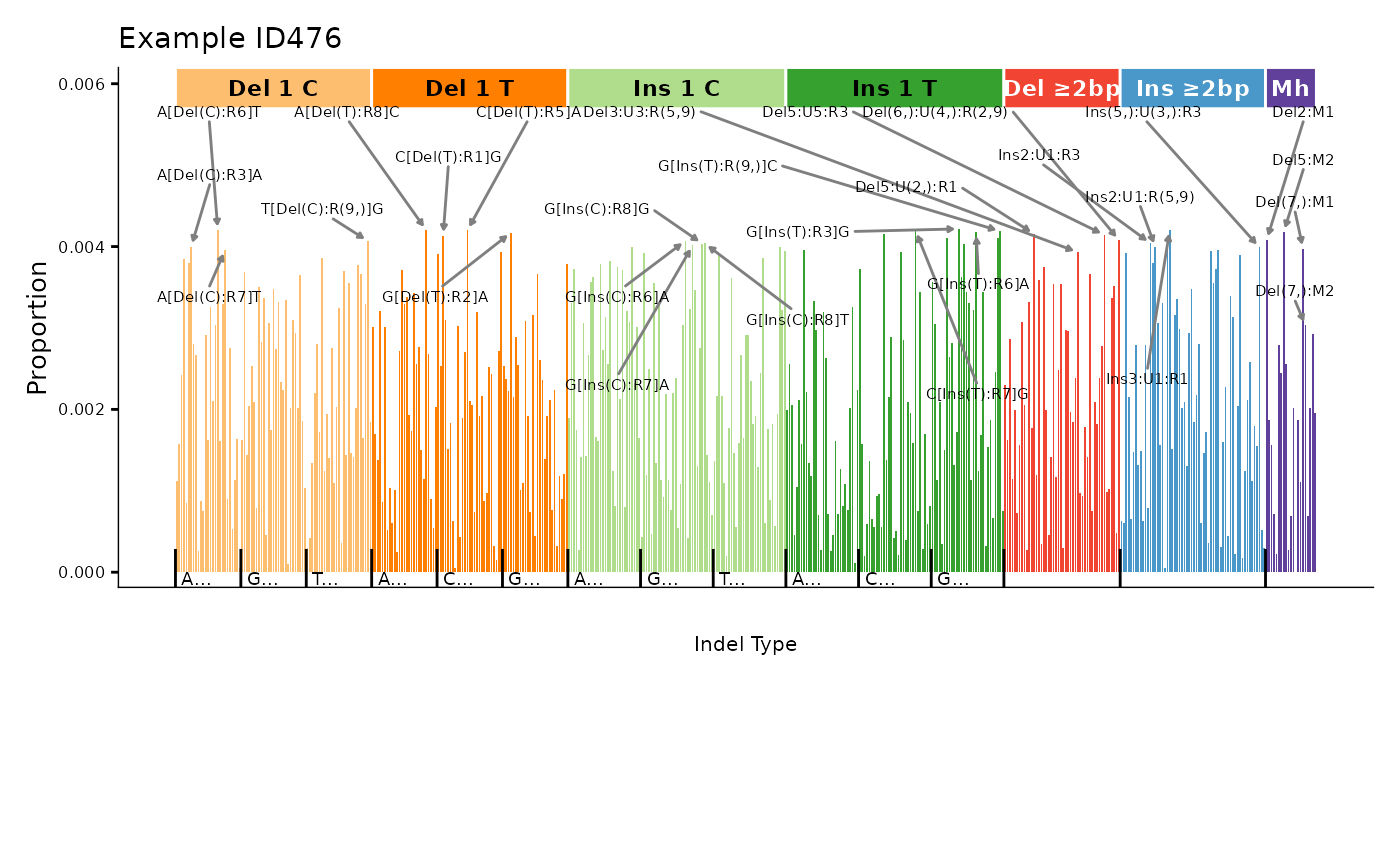
plot_ID476(sig, plot_title = "Example ID476")
# \donttest{
set.seed(1)
sig <- runif(476)
sig <- sig / sum(sig)
names(sig) <- catalog_row_order()$ID476
plot_ID476(sig, plot_title = "Example ID476")
 # }
# \donttest{
set.seed(1)
sig <- runif(476)
sig <- sig / sum(sig)
names(sig) <- catalog_row_order()$ID476
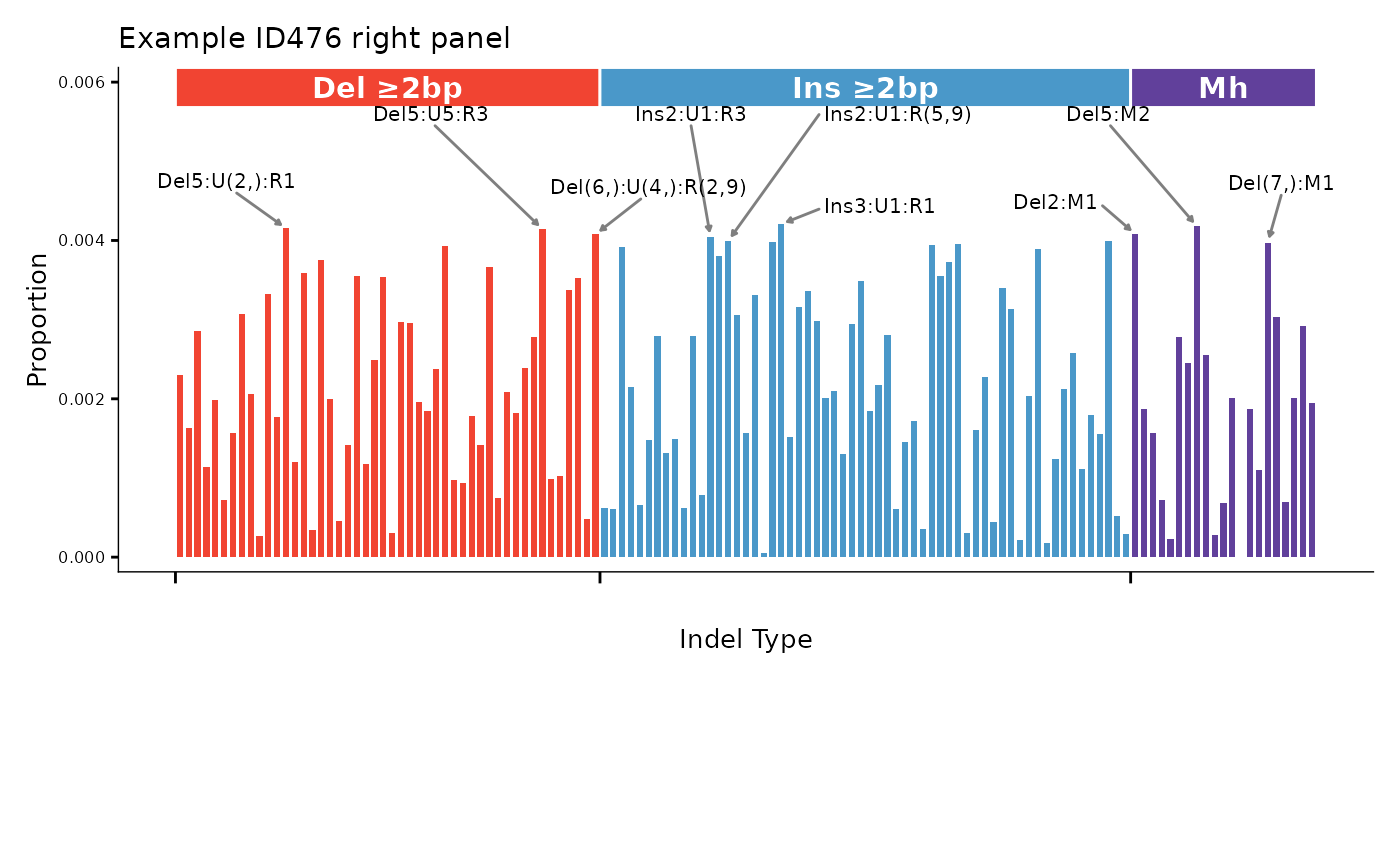
plot_ID476_right(sig, plot_title = "Example ID476 right panel")
# }
# \donttest{
set.seed(1)
sig <- runif(476)
sig <- sig / sum(sig)
names(sig) <- catalog_row_order()$ID476
plot_ID476_right(sig, plot_title = "Example ID476 right panel")
 # }
set.seed(1)
sig <- runif(83)
sig <- sig / sum(sig)
names(sig) <- catalog_row_order()$ID
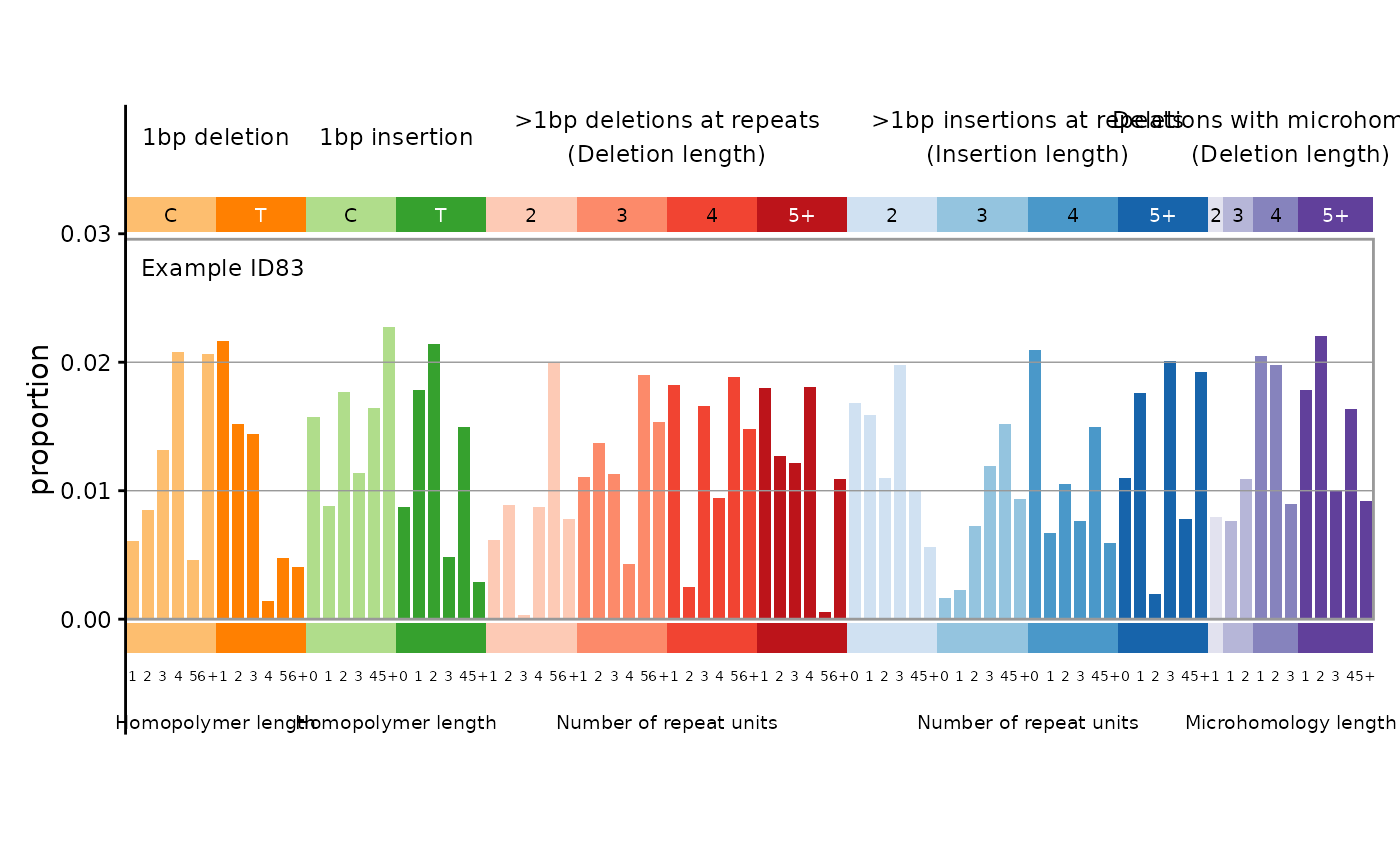
plot_ID83(sig, plot_title = "Example ID83")
# }
set.seed(1)
sig <- runif(83)
sig <- sig / sum(sig)
names(sig) <- catalog_row_order()$ID
plot_ID83(sig, plot_title = "Example ID83")
 set.seed(1)
sig <- runif(89)
sig <- sig / sum(sig)
names(sig) <- catalog_row_order()$ID89
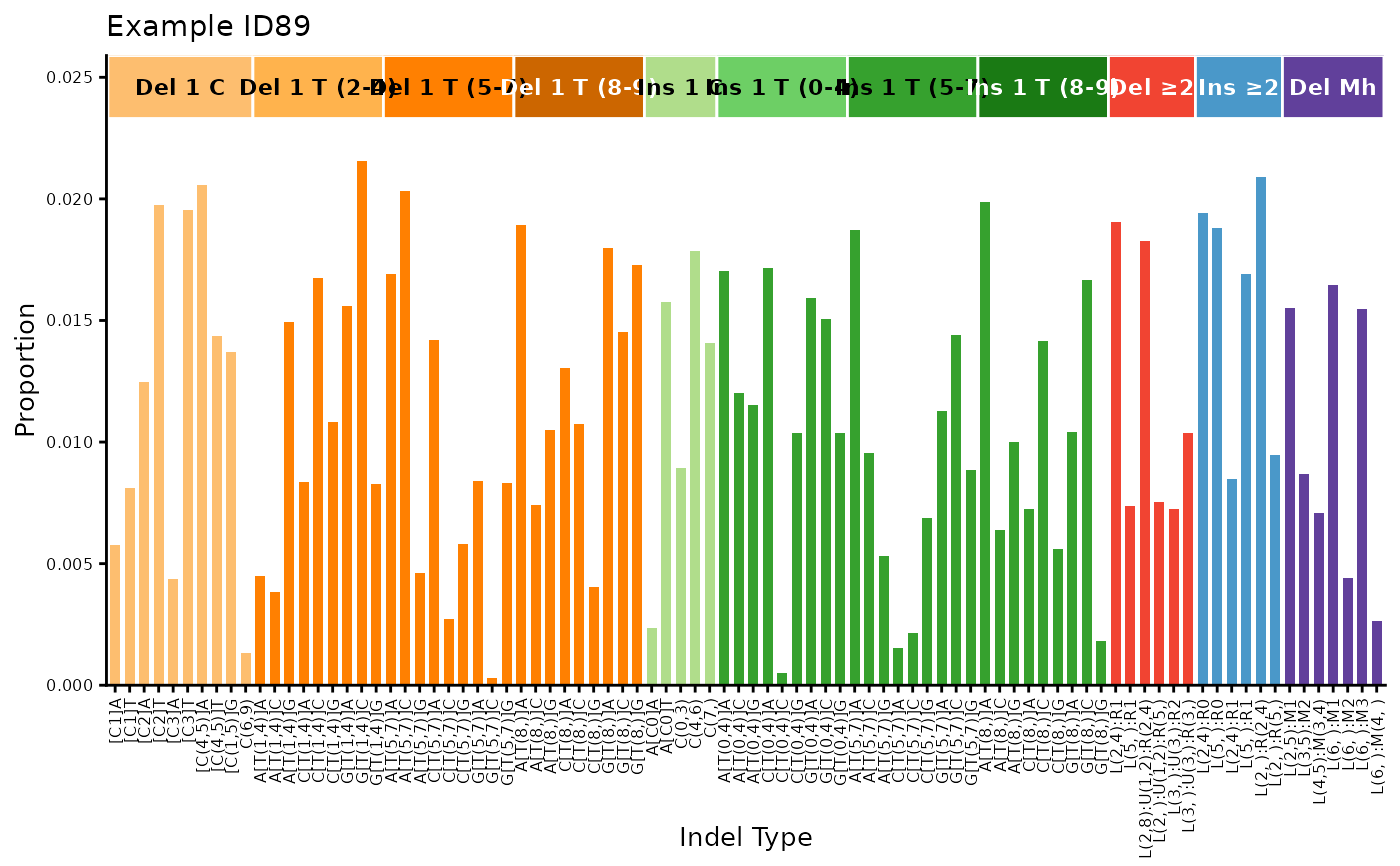
plot_ID89(sig, plot_title = "Example ID89")
set.seed(1)
sig <- runif(89)
sig <- sig / sum(sig)
names(sig) <- catalog_row_order()$ID89
plot_ID89(sig, plot_title = "Example ID89")
 set.seed(1)
sig <- runif(192)
sig <- sig / sum(sig)
names(sig) <- catalog_row_order()$SBS192
plot_SBS12(sig, plot_title = "Example SBS12 strand bias")
set.seed(1)
sig <- runif(192)
sig <- sig / sum(sig)
names(sig) <- catalog_row_order()$SBS192
plot_SBS12(sig, plot_title = "Example SBS12 strand bias")
 set.seed(1)
sig <- runif(192)
sig <- sig / sum(sig)
names(sig) <- catalog_row_order()$SBS192
plot_SBS192(sig, plot_title = "Example SBS192 signature")
set.seed(1)
sig <- runif(192)
sig <- sig / sum(sig)
names(sig) <- catalog_row_order()$SBS192
plot_SBS192(sig, plot_title = "Example SBS192 signature")
 # \donttest{
set.seed(1)
sig <- runif(288)
names(sig) <- catalog_row_order()$SBS288
plot_SBS288(sig, plot_title = "Example SBS288")
# \donttest{
set.seed(1)
sig <- runif(288)
names(sig) <- catalog_row_order()$SBS288
plot_SBS288(sig, plot_title = "Example SBS288")
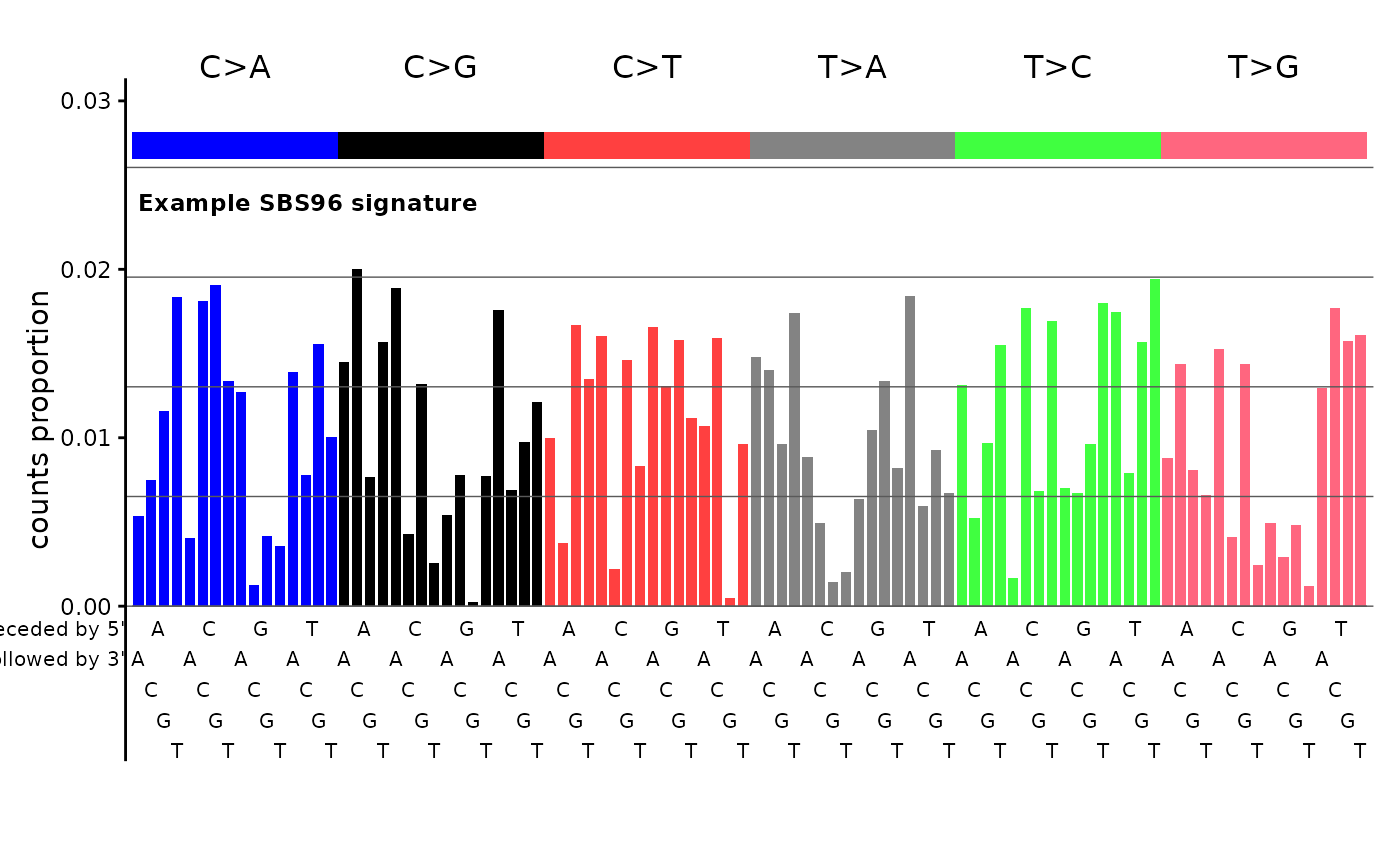 # }
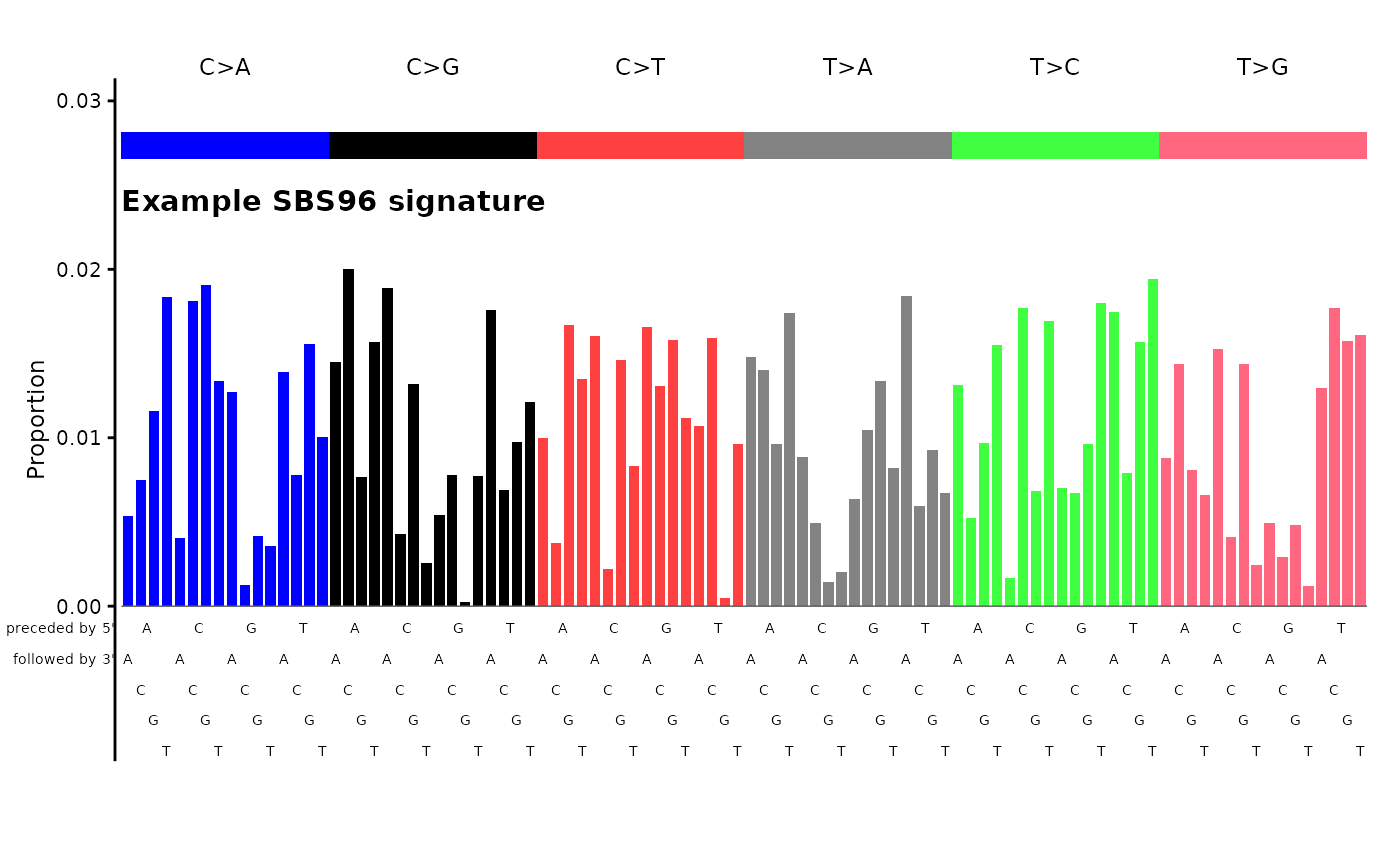
# Plot a random SBS96 signature (proportions summing to 1)
set.seed(1)
sig <- runif(96)
sig <- sig / sum(sig)
names(sig) <- catalog_row_order()$SBS96
plot_SBS96(sig, plot_title = "Example SBS96 signature")
# }
# Plot a random SBS96 signature (proportions summing to 1)
set.seed(1)
sig <- runif(96)
sig <- sig / sum(sig)
names(sig) <- catalog_row_order()$SBS96
plot_SBS96(sig, plot_title = "Example SBS96 signature")